Articles
5 min read
Editing reports in BI Book
Published on
July 20, 2021

Editing reports in BI Book is easy and takes only a few clicks. With BI Book, you can build a variety of reports for an unlimited number of different audiences with these instructions!
Please note that editing reports in BI Book require either Admin or Editor rights. Therefore, users with only reader rights will not be able to edit reports in BI Book.
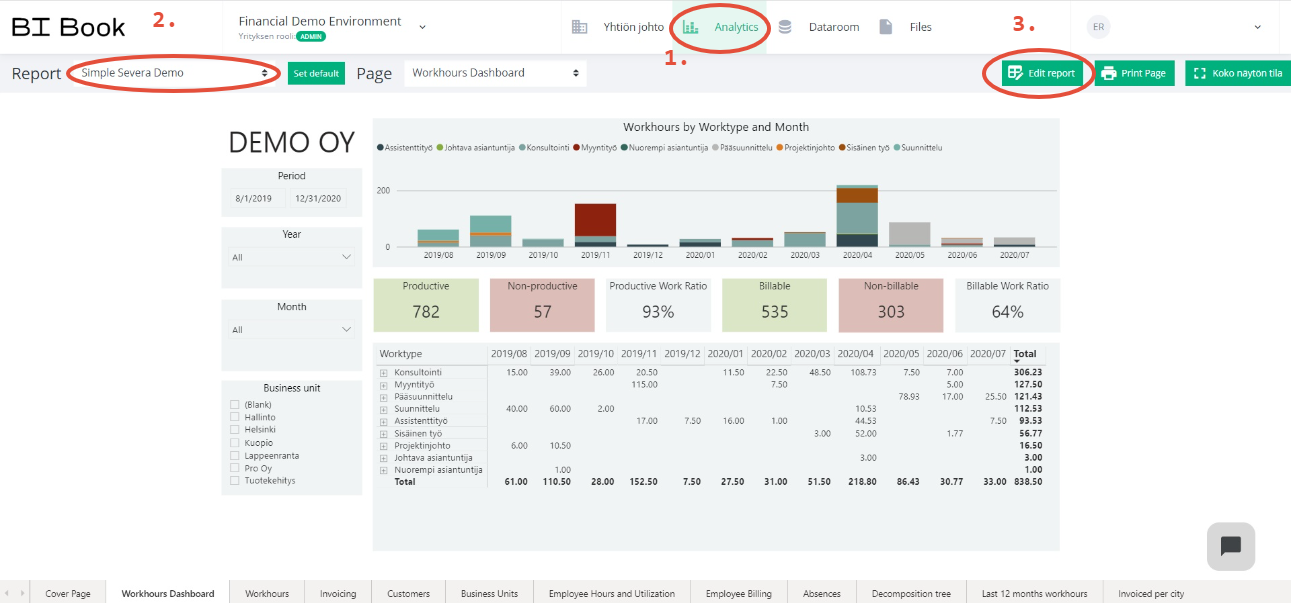
1. To start editing reports in BI Book, select "Analytics" from the top bar.
2. Select the report you'd like to edit from the drop-down menu in the upper-left corner.
3. Click "Edit report" in the upper right corner.
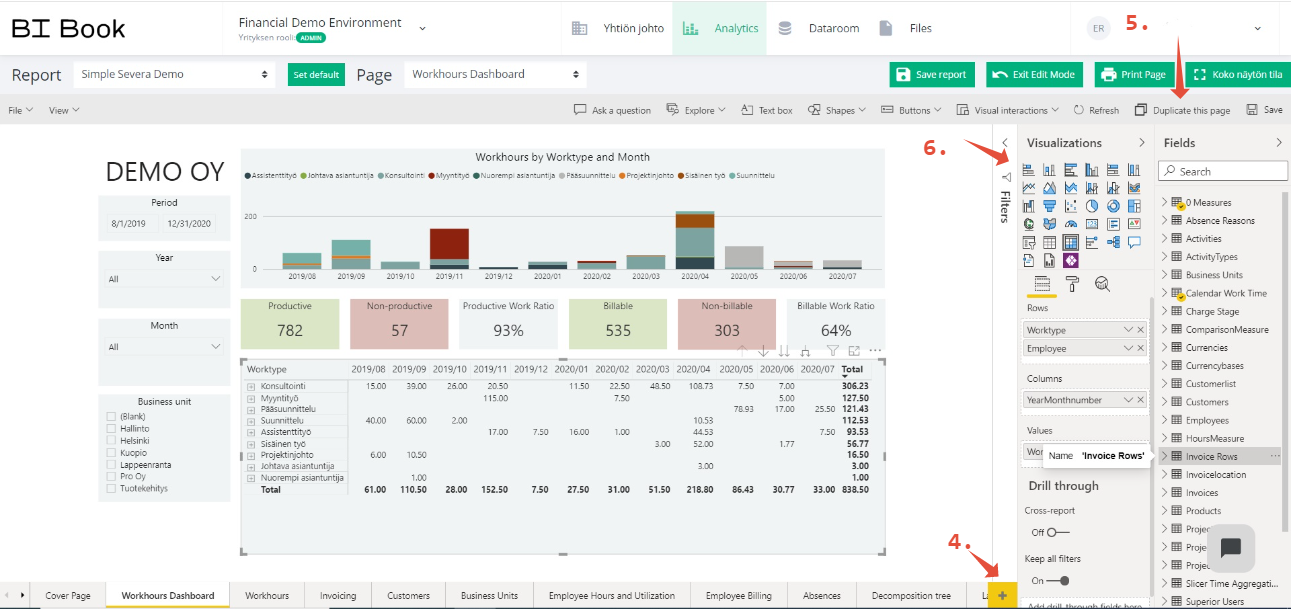
4. To add a new page to the report, click the plus in the lower right corner.
5. If you want to edit an existing page, we recommend you duplicate it by clicking "Duplicate this page." Therefore, the original page will remain the same, and you can return to it if you are not satisfied with the edits you have made.
6. You can edit existing graphs by clicking on the graph in the report and then clicking the chosen graph under the "Visualizations" heading on the right-hand side.
7. If you want to change what information a particular graph represents, click the graph on the report. Information on the data used by the graph can then be found under the heading "Fields." From this section, you can see what information the current graph contains. The graph contains information about the categories marked with a small checkmark on a yellow background. Next to the checkmark is a small black arrow that you can click to get more detailed information about what data the graph is utilizing from that category. From the same location, you can also choose what data you want the customized graph to contain.
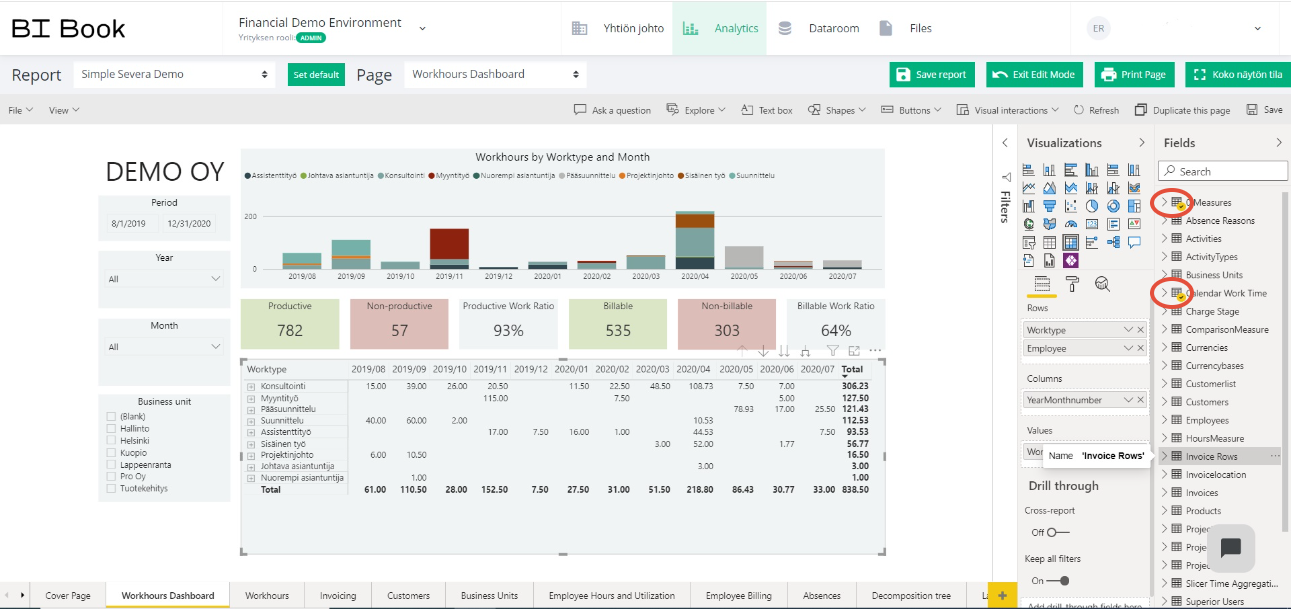
When practicing how to use the BI Book, you may want to take advantage of this approach. It will help you understand what information your chosen graph is utilizing and how it changes when you extract data from different categories. Remember to save the report by clicking "Save report" when you are happy with the edits!
BI Book graphs can be copied by clicking them and pressing Ctrl + C and then Ctrl + V. This is useful, for example, when you want to edit what information an existing graph contains. This allows you to take a template from an existing graph and use it to make changes to the copy of the graph.
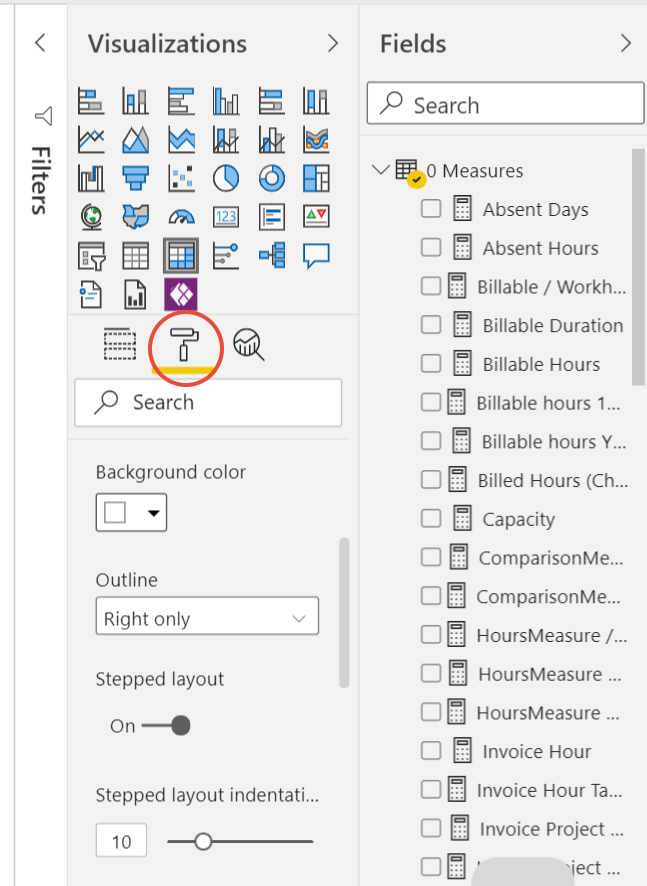
You can customize the report's appearance, such as the colors used in the graphs, text fonts, and graph headings, by clicking the roller icon. From there, you can also, for example, customize reports to fit your brand look.
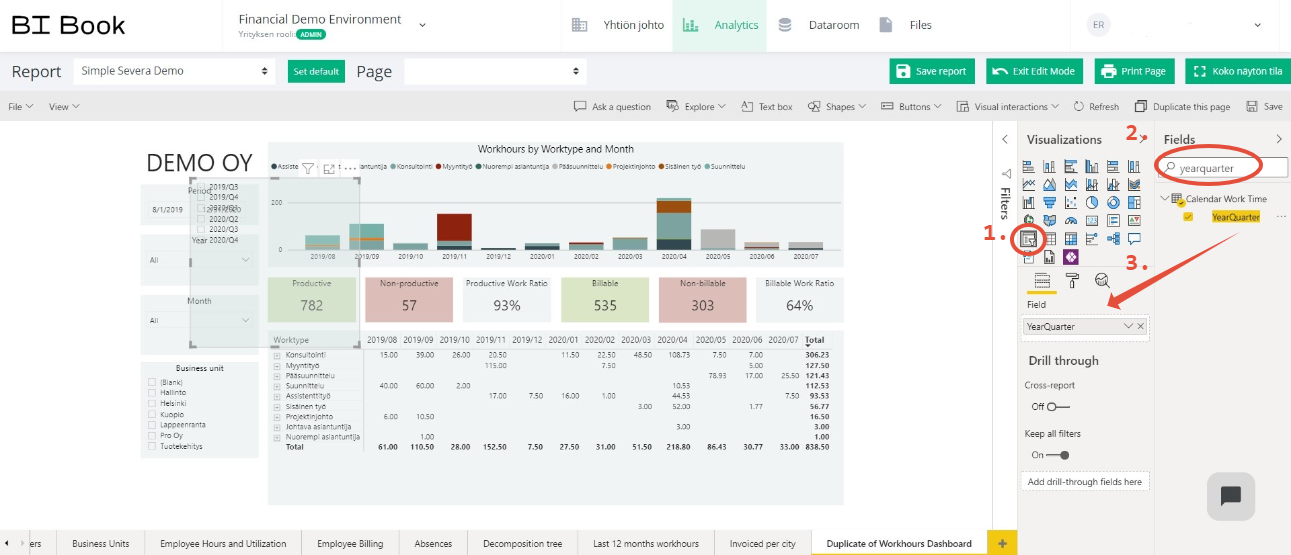
1. To add new filters to your reports, click "Slicer" under the "Visualizations" heading. This will create a new empty filter for which you must next select filtering criteria. Move the filter you created to where you want it in the report.
2. If you want to filter the report data by quarter, for example, write "YearQuarter" to the field below the "Fields" heading.
3. Drag the revealed "YearQuarter" to the empty box under the "Field" subheading in the Visuliaztion bar.
In BI Book, it is also possible to create new graphs from scratch using the pre-built calculation formulas.
1. Click an empty spot in the report, and then under the "Visualization" heading, select the type of graph you want to create.
2. Now you have a graph, and next, you need to select under the "Fields" heading what information you want to display in the graph. This is done by typing in the search box what information and calculation formulas you want to use. Building completely new graphs from the beginning requires understanding the different calculation formulas and outlining how different graphs are constructed in BI Book. We will be happy to instruct you more on this.
Please don't hesitate to contact us, if you need any help with BI Book. We are here to help you. You can for example call our Analytics Onboarding Specialist Niklas Säderström at +358 45 7832 5824 and book a free sparring session.
You can find more instructions on using BI Book here.
We would love to hear from you. Contact us today!